
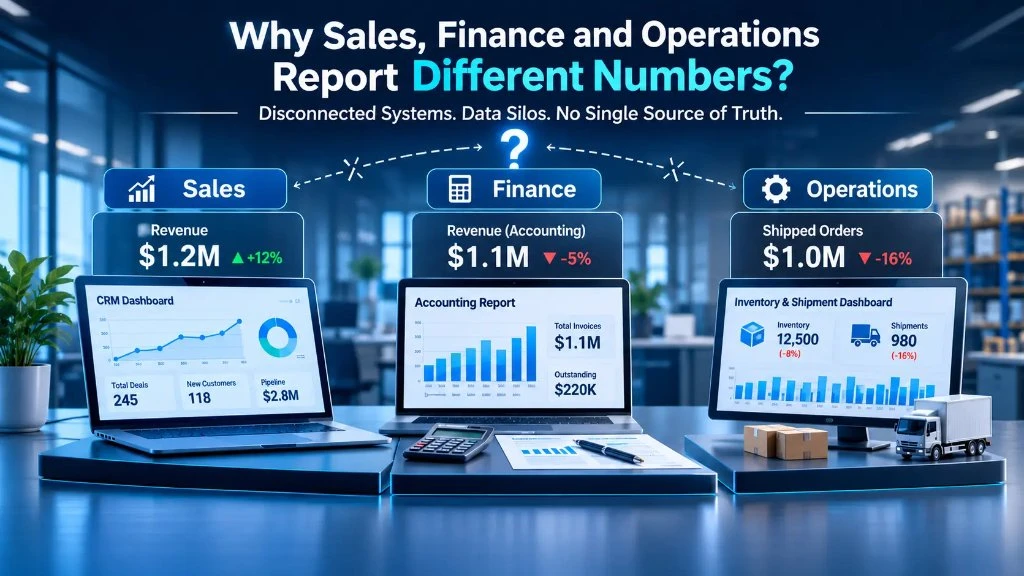
Why do sales, finance, and operations report different numbers? They use separate systems, conflicting metric definitions, misaligned update frequencies, and fragmented data ownership. Cross-functional workflow automation resolves this by connecting underlying systems, defining one authoritative source of truth for each business field, validating records automatically in-flight, and routing exceptions to the right owner before they distort executive reporting.
1. Introduction
Sales says revenue is up. Finance says the numbers do not match. Operations says shipments are delayed, inventory is wrong, or a customer order is stuck.
This is not usually a people problem. It is a data consistency problem caused by departmental data silos, manual re-entry, unclear ownership, and systems that do not stay synchronized.
Cross-functional workflow automation helps fix this by connecting sales, finance, and operations data in one controlled flow. Instead of exporting spreadsheets, emailing updates, and reconciling figures at month-end, teams work from shared rules, shared records, and automatic checks.
2. The Real Cost of Conflicting Numbers
When departments disagree on basic business numbers, the damage goes far beyond an awkward leadership meeting:
Slow decisions
Leaders wait for "the final number" instead of acting quickly on market opportunities.
Forecast errors
Sales pipeline, production plans, cash flow, and inventory plans drift dangerously apart.
Month-end pressure
Finance teams spend valuable days investigating variances rather than analyzing profitability.
Customer risk
Orders get accepted when actual stock, credit limits, pricing, or production capacity cannot support them.
Compliance & audit risk
Manual adjustments and undocumented spreadsheet edits make it harder to trace audit histories.
Lost trust in data
Frustrated department heads build private shadow spreadsheets because they distrust central reports.
3. Why the Numbers Rarely Match
Different departments are not necessarily looking at wrong data. They are often looking at different versions of the same business event:
| Business question | Sales sees | Finance sees | Operations sees |
|---|---|---|---|
| "What is revenue?" | Booked pipeline or closed deals | Invoiced, recognized, or collected revenue | Shipped or delivered orders |
| "Is the order complete?" | Customer accepted the quote/deal | Invoice created or payment received | Stock allocated, dispatched, and signed for |
| "Is inventory available?" | CRM or quoting tool catalogue | ERP balance sheet stock valuation | Warehouse physical bin or production buffer |
| "Is the customer profitable?" | Deal volume and initial discount tier | Invoice margin, credit terms, and receivables | Fulfilment, returns, and ongoing servicing costs |
The problem is not that one department is lying. Each team is answering a different operational question using a different software system, metric definition, and timing window.
4. The Root Causes
Why Business Data Breaks Down Across Systems
When departments operate on isolated software platforms, discrepancies compound across the entire operational chain:
- Departmental data silos (CRM, ERP, and WMS)
- No agreed authoritative "system of record"
- Manual spreadsheet copying & hidden formula errors
- Conflicting metric definitions between teams
- Asynchronous batch update delays
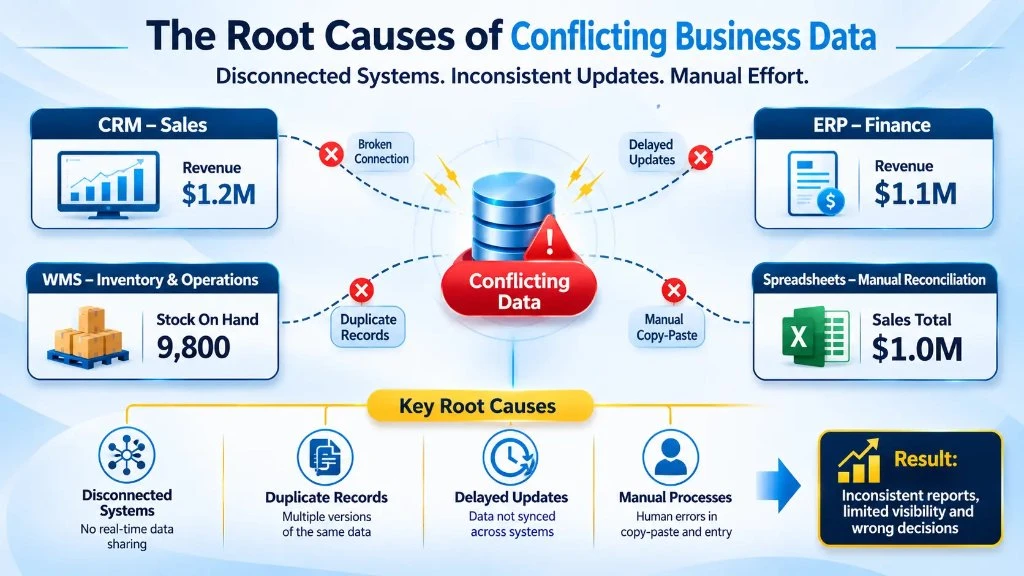
Departmental data silos
Sales works inside CRM, finance works inside ERP, and operations operates in specialized WMS or MES platforms. McKinsey research reveals that 80% of surveyed organizations operate in silos, each managing its own source data and procedures.
No agreed "system of record"
When CRM, ERP, and operations platforms all store customer and order records, no single record is authoritative. A client may be updated in CRM but remain outdated in ERP. Deals marked "closed-won" may never convert to an ERP sales order.
Manual data entry and spreadsheet reconciliation
Copying and pasting records between disparate tools inevitably introduces typos. Spreadsheets obscure broken formulas, break audit trails, and depend on individual memory rather than governed rules.
Different definitions of the same metric
"Revenue," "order value," "delivery date," "active customer," and "available stock" carry divergent definitions across departments. Without centralized definitions, every department's dashboard is technically accurate yet collectively contradictory.
Late or inconsistent synchronization
If CRM updates in real time, ERP synchronizes overnight, and the warehouse only transmits batched dispatch notes, reports will never align at any single moment. Synchronization must reflect business impact rather than arbitrary scheduling.
5. Why Conventional Fixes Fail
Many leadership teams attempt to resolve data discrepancies by adding more meetings, building ad-hoc spreadsheets, or deploying visualization dashboards. These approaches mask symptoms without fixing root causes:
More meetings: Creates alignment for a single afternoon, but fails to create a repeatable system.
More spreadsheets: Introduces yet another conflicting version of operational truth.
A new BI dashboard: Merely visualizes flawed, stale data with prettier charts.
Point-to-point scripts: Connects two software endpoints but leaves validation gaps, unmonitored errors, and maintenance debt.
"Last write wins" syncing: Silently overwrites valid transactions without alerting data owners or tracking reasons.
The Architectural Takeaway: The issue is never just connecting software APIs. True resolution requires governed, validated, and monitored data flow that automates operational steps across department lines.
6. What Cross-Functional Workflow Automation Means
Cross-functional workflow automation orchestrates connected processes to move, validate, approve, and reconcile records across disparate enterprise systems.
From Siloed Records to a Unified Data Pipeline
A cross-functional automation platform orchestrates data across departments, applying validation rules before records post:
- Bi-directional real-time sync between CRM, ERP, and WMS
- Automated business rules & shared metric definitions
- In-flight data validation checks before posting
- Instant exception routing to named owners
- One authoritative single source of truth
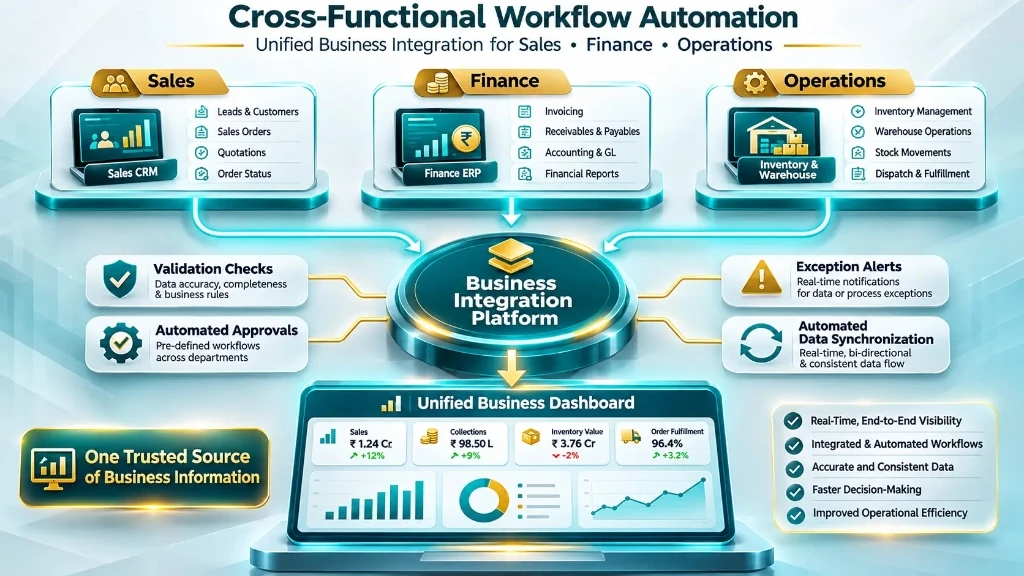
It is fundamentally more capable than a simple API bridge. A basic integration moves raw data from Point A to Point B. A cross-functional automation architecture defines:
Connected Systems
CRM • ERP • WMSBusiness Rules
Shared definitionsValidation Checks
Auto validationException Routing
To named ownersSingle Source of Truth
Consistent numbersReal-World Example: When sales closes a customer order in CRM, the automation platform validates customer credit terms, inventory availability in WMS, approved discounting rules, and tax profiles before initiating an ERP order. If a credit limit is breached, the exception alerts the credit controller immediately—rather than showing up as an unresolved discrepancy weeks later.
7. A Practical Framework: The 5-Step Data Consistency Model
A structured, proven model to eliminate metric disagreements and maintain synchronization across teams:
Step 1: Define the Business Event
Start with a real business process such as order-to-cash, procure-to-pay, or forecast-to-production.
Do not begin with software packages or API connectors. Begin with the precise operational moment when sales, finance, and operations all interact with the same customer order or inventory commitment. Identify the exact triggers, required outputs, and where handoffs break.
8. Key Data Objects & Validation Rules
Key Data Objects & System of Record
| Data object | System of record | Why it matters |
|---|---|---|
| Customer master | CRM (synced to ERP) | Single, clean customer profile |
| Sales order | ERP (linked to CRM) | Unified order value and status |
| Invoice / Ledger | ERP / Accounting | Definitive revenue recognition |
| Inventory / Stock | WMS / ERP | Accurate delivery availability |
| Dispatch / POD | TMS / WMS | Real-time shipment proof |
Validation Examples (Automated Checks)
- Invoices post only when orders are confirmed and within credit limits.
- Dispatch triggers only if physical inventory is reserved and verified.
- Revenue recognition follows standardized policy (e.g., proof of delivery).
- Exceptions (price variances, stockouts, credit blocks) alert owners instantly.
- Automated three-way matching validates POs, goods receipts, and invoices.
9. Monitoring and Success KPIs
Treat cross-functional data synchronization as an ongoing operational discipline, not a one-off integration checklist:
10. Before vs After: The Impact
Before (Siloed Processes)
- Conflicting figures across department meetings
- Days lost to manual month-end reconciliation
- High error rates, stockouts, and invoicing delays
- Erosion of trust in centralized business dashboards
- Leadership debates arithmetic: "Whose number is right?"
After (With Workflow Automation)
- One governed, trusted number across every report
- Continuous automated matching and instant exception alerts
- Faster order-to-cash execution and predictable cash flows
- Higher trust, cross-functional collaboration, and accountability
- Leadership debates strategic actions rather than data accuracy
11. Industry Use Cases
Cross-functional workflow automation provides tangible operational clarity across diverse industries:
Manufacturing
Connects sales order commitments with shop-floor machine run-rates, WIP inventories, and automated dispatch billing.
Automotive
Synchronizes tier-1 OEM delivery slots, buffer inventories, component warranties, and vendor receivables.
Aviation & Logistics
Reconciles proof-of-delivery notes, freight rate tariffs, MRO spares availability, and carrier billing.
Healthcare
Coordinates patient treatments, pharmaceutical inventory consumption, insurance billing claims, and revenue recognition.
Finance & Banking
Unifies loan approvals, underwriting documentation, transaction ledgers, and automated compliance auditing.
Telecom & Retail
Harmonizes omnichannel customer purchases, payment gateway settlements, returns, and subscriber lifecycle billing.
12. How Vivify Soft Tech Can Help
Once the root causes are identified, the next step is not simply buying another dashboard tool. It is designing an enterprise operating fabric across people, systems, and decisions.
Vivify Soft Tech partners with industrial manufacturers, commercial enterprises, and distributors to deploy AI-driven workflow automation, robust ERP data synchronization, and modern system architectures. A typical engagement follows our 6-step roadmap:
Process Mapping: Map existing sales, finance, and operational flows across departments.
System Audit: Identify all shadow spreadsheets, manual handoffs, and data owners.
Metric Governance: Codify shared metric definitions, systems of record, and validation gates.
Workflow Prioritization: Focus on high-impact bottlenecks like order-to-cash or procure-to-pay.
Automation Deployment: Implement bi-directional sync with real-time audit logs and exception handling.
Continuous Improvement: Train stakeholders and monitor data consistency KPIs on ongoing dashboards.
13. Frequently Asked Questions (FAQs)
They use different systems, definitions, update times, and data owners. Sales may track booked orders in CRM, finance tracks invoiced or recognized revenue in ERP, and operations tracks shipped or delivered goods in WMS. Without an automated sync layer, each department looks at a conflicting snapshot of the same event.