
Causes of Unplanned Downtime:
Why Stoppages Keep Recurring in Modern Manufacturing
A breakdown is rarely just an isolated equipment fault. Unplanned downtime hides in the operational gaps between machines, operators, and siloed data. Discover why root causes evade detection—and how connected IIoT and OEE intelligence turn invisible stoppages into recovered plant capacity.
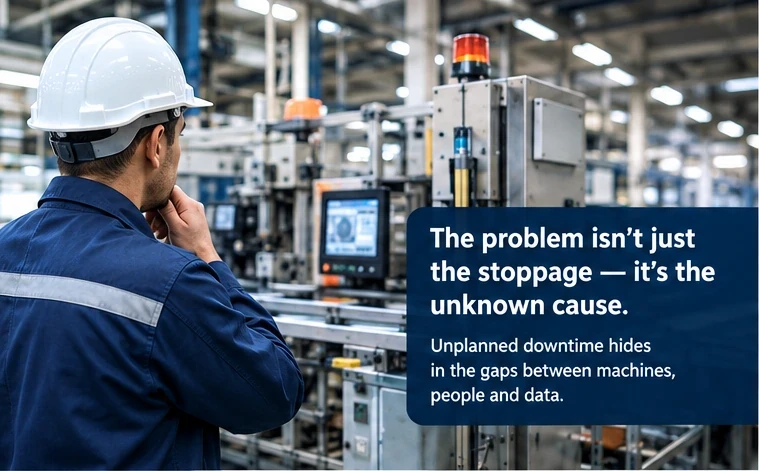
Why Manufacturers Struggle to Identify the Real Cause of Unplanned Downtime
A high-speed production line suddenly halts. The shift maintenance team rushes to the cell, inspects the mechanical drive, swaps out a failed sensor or worn bearing, resets the line, and gets components moving again.
Operators return to their stations. Output resumes. The immediate crisis is averted, and the incident is marked “resolved” in the shift log.
Then, three days later, on a different shift, the exact same machine stops again.
For plant managers, operations directors, and maintenance leads, this cycle is painfully familiar. Manufacturing teams are exceptionally skilled at rapid firefighting and returning downed machinery to operation. However, identifying why the breakdown happened in the first place is infinitely more complex. When underlying root causes remain invisible, identical failures recur repeatedly—quietly draining plant availability, inflating scrap rates, burning overtime labor, and jeopardizing customer delivery commitments.
The fundamental question modern manufacturers must answer is not merely “Which component failed?”, but rather “What sequence of operational deviations occurred before the stoppage, and were the warning signs visible in the data?”
What Does Unplanned Downtime Really Mean?
At its most straightforward, unplanned downtime occurs whenever an asset, manufacturing cell, or entire line ceases operation unexpectedly during scheduled production hours.
A catastrophic mechanical seizure or blown motor is the most visible example, but it is far from the only one. In real factory environments, unplanned stoppages are equally driven by raw material inconsistencies, upstream feeding jams, out-of-spec part dimensions, software communication dropouts, incorrect recipe parameters, or delays while operators wait for maintenance assistance.
Consider a high-speed packaging or stamping line experiencing recurring micro-stops throughout a shift. A maintenance technician may diagnose a jamming feed belt as a mechanical alignment error. However, a multi-parameter diagnostic analysis might reveal that the stoppages only coincide with a specific supplier's carton stock combined with fluctuating ambient humidity. Replacing mechanical rollers will never solve that problem.
This distinction between the immediate symptom and the underlying root cause defines the difference between reactive patchwork and permanent operational improvement. To analyze stoppages rigorously, industrial engineers categorize downtime across five interconnected domains:
Equipment Failure
Drive motor trips, roller bearing overheats, pneumatic cylinder sticks, or an optical sensor ceases signal transmission.
Was there an earlier thermal or vibration signature of deterioration? Was preventive lubrication missed or operating load exceeded?
Process Instability
Repeated parts jamming, fluctuating hydraulic pressure, erratic tooling cycle times, or conveyor bottlenecks.
Did operating parameters (speed, temperature, tonnage, feed rate) drift outside baseline operating tolerances?
Material & Quality
High scrap rates, dimensional deformation, burrs, or feed failures during high-speed feeding runs.
Was incoming raw material tensile strength, thickness, or moisture variance responsible? Did supplier lot changes correlate with stops?
Human & Procedural
Setup errors during tooling changeovers, incorrect offset calibration, or delayed operator response to machine warnings.
Were standard operating procedures (SOPs), calibration guides, and alarm escalation protocols clear, accessible, and trained?
Data & Systems
Missing production logs, alarm floods obscuring critical faults, or mismatched downtime records between shifts.
Was machine telemetry connected across ERP, MES, and SCADA architectures to provide contextualized operational visibility?
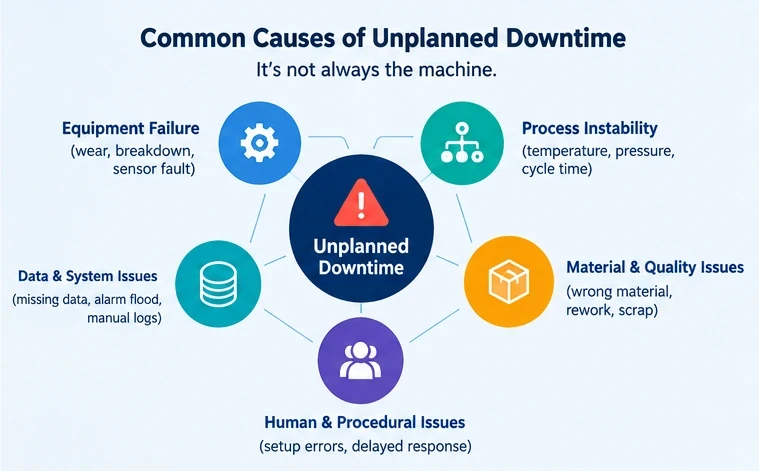
Most serious manufacturing stoppages involve interactions across two or more of these categories. Understanding how process conditions, operator actions, and mechanical stresses converge is what transforms temporary fixes into durable plant capacity.
Why Is the Real Cause of Machine Downtime So Difficult to Find?
If eliminating downtime is universally recognized as a top priority for plant profitability, why does finding the true root cause remain so elusive? Through hundreds of shop-floor automation assessments, Vivify Soft Tech has identified six systemic obstacles:
1. Teams Record the Breakdown but Miss the Preceding Sequence of Events
A standard manual or semi-automated downtime report might state: “Conveyor 3 stopped for 45 minutes due to drive jam.”
While accurate on the surface, that log gives the reliability team zero insight into how the failure formed. In reality, modern machinery rarely fails spontaneously; physical degradation is almost always preceded by identifiable telemetry anomalies.
Without connected telemetry, the factory only sees the final symptom—the line halt—while the early warning signals that built up over days or shifts remain completely unrecorded.
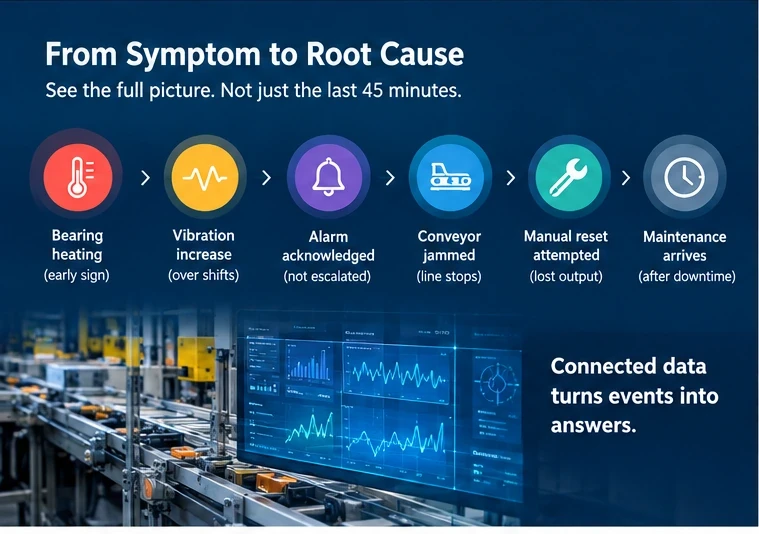
A roller bearing begins operating 12°C hotter than nominal baseline—an early friction indicator.
Over the next three shifts, harmonic vibration escalates as micro-pitting develops on the bearing race.
An automated warning flashes on the local HMI, but without context, it is acknowledged without maintenance escalation.
The seized bearing causes the drive belt to slip and bind, stopping the entire packaging line.
Operators attempt two power cycles before concluding the fault requires mechanical intervention, losing 15 minutes.
Technicians replace the belt and bearing. The 45-minute outage is logged simply as a “belt repair.”
2. Critical Operational Data Is Fragmented Across Siloed Systems
In the majority of industrial plants, machine signals live in PLCs and SCADA networks; maintenance logs reside in a computerized maintenance management system (CMMS); quality defects are tracked on QA tablets or paper inspection sheets; and production schedules are stored in the enterprise ERP or master Excel files.
Each system represents an isolated puzzle piece. When production reports falling hourly yield, QA reports a surge in scrap parts, and maintenance logs recurring motor over-current warnings, they frequently initiate three completely separate investigations into what is actually a single, connected process failure.
Connecting these disparate streams through modern industrial software and real-time production monitoring is the prerequisite for holistic root-cause identification.
3. Manual Downtime Logs Suffer From Cognitive Bias and Approximations
Paper clipboard logs and shift-end spreadsheets are common starting points, but they inevitably degrade diagnostic accuracy. Operators are tasked with meeting demanding production quotas; when a line trips, their immediate priority is restoring motion, not performing forensic journalism.
Start and stop times get rounded to nearest 5 or 15-minute intervals. One operator categorizes a sensor blink as “electrical failure,” while another logs the same occurrence on the subsequent shift as “operator adjustment.” Building continuous improvement initiatives upon distorted manual data will simply produce well-formatted charts of false assumptions.
4. High-Frequency Short Stoppages (“Micro-Stops”) Evade Human Notice
Not all catastrophic downtime occurs in single multi-hour blocks. In stamping, bottling, packaging, and automotive assembly, brief stoppages lasting 30 to 120 seconds occur constantly as operators clear minor jams, reposition stock, or reset feed sensors.
Because each stoppage feels negligible in isolation, operators rarely record them. Yet repeated twenty times a shift, micro-stops secretly rob a plant of 10% to 20% of its nameplate capacity. Exploring why stamping lines lose capacity to micro-stops illustrates why automatic machine-state logging is necessary to make hidden capacity losses visible.
5. Alarm Floods Create Cognitive Fatigue and Desensitization
More alerts do not equal better operations. When a packaging or CNC machine trips, a cascade of 40 simultaneous alarms can flash across the HMI screen within seconds. Without intelligent alarm suppression and priority classification, operators become desensitized to nuisance alerts, making it nearly impossible to spot the single critical warning that caused the primary line trip.
6. Root-Cause Investigations Terminate at the First Plausible Mechanical Culprit
When a drive coupling snaps, the immediate conclusion is often: “The coupling was defective or reached end of life.” A new coupling is installed, and the ticket is closed.
True root-cause analysis demands asking the next order of questions: Why was that coupling subjected to excessive rotational stress? Did an upstream tooling recipe increase mechanical resistance? Was thermal expansion throwing shaft alignment out of tolerance? Stopping at the first component replacement guarantees that the underlying mechanical environment will destroy the replacement part on schedule.
What Does Unplanned Downtime Actually Cost a Factory?
The financial penalty of an unexpected stoppage is rarely confined to the replacement spare part invoice. When a core bottleneck asset stops, the economic fallout ripples across the entire facility.
Finished units that could have been produced, delivered, and billed during that operational window vanish permanently from company revenue.
Machine operators, quality technicians, and downstream assembly lines stand idle waiting for machines to restart, compounding hourly costs.
Unscheduled maintenance incurs premium technician overtime, expedited air-freight for emergency spare parts, and third-party contractor callout fees.
Restarting thermal, chemical, or high-speed stamping processes invariably generates warm-up scrap, purge material, and defective batches.
Missed dispatch commitments damage customer trust, trigger SLA penalty clauses in automotive or tier-1 contracts, and demand rush freight.
Recurring downtime forces plant leaders to purchase unnecessary duplicate machines or approve overtime shifts to meet targets their existing equipment should easily handle.
Rather than relying solely on global benchmarks, every plant must calculate its own true cost of lost production per critical line. Quantifying labor idle time, scrap, and margin loss per minute provides the financial justification for investing in automated machine monitoring.
A Practical 5-Part Diagnostic Framework for Finding the Root Cause
Manufacturers do not need to overhaul their entire shop floor overnight. A disciplined approach begins by systematically interrogating five operational dimensions around a single critical bottleneck asset:
| Investigation Dimension | Core Diagnostic Questions | Essential Data Sources |
|---|---|---|
| 1. Asset Condition | Was the mechanical or electrical asset exhibiting subtle pre-failure symptoms in the days or shifts prior to the stop? | Vibration spectrum trends, bearing temperature curves, motor current draws, pressure sensors, and lubrication service history. |
| 2. Process Performance | Did operating velocity, feed rates, cycle times, or tooling temperatures drift outside optimum windows before the stoppage? | PLC cycle times, SCADA process trend archives, thermal sensor logs, and line speed tachometers. |
| 3. Production Context | Did the stoppage coincide with a specific SKU, tooling changeover, raw material lot, or shift handover? | ERP work orders, batch traveler sheets, changeover timing logs, and operator shift rosters. |
| 4. Quality & Materials | Did variations in incoming raw materials (hardness, thickness, moisture) impose abnormal physical resistance on the line? | Supplier inspection certificates, automated vision inspection reject logs, and rework tickets. |
| 5. Procedural Response | Was an earlier warning alarm triggered, and what were the operator response and escalation timelines? | HMI alarm event logs, acknowledgment timestamps, and operator standard operating procedures (SOPs). |
The ultimate breakthrough comes from connecting the evidence. For example, an intermittent line trip may look like a random motor overheating fault. By cross-referencing motor telemetry with ERP work orders, the engineering team discovers that overheating occurs only when processing a specific heavy gauge material run on the afternoon shift, where ambient plant temperatures exceed 36°C. That single insight shifts the solution from replacing a motor to reconfiguring cooling ventilation or tuning feed rate parameters.
How IIoT and OEE Monitoring Help Manufacturers Understand Downtime
Industrial Internet of Things (IIoT) sensors, edge gateways, and intelligent analytics grant plant leadership continuous, high-definition visibility into shop-floor reality. Instead of debating retrospective opinions at morning production meetings, teams work with unambiguous operational facts.
By linking machine cycles, real-time vibration, thermal trends, and quality rejects directly to OEE metrics, manufacturers eliminate the manual guesswork behind why lines stop.
A high-yield continuous monitoring architecture unites six foundational pillars:
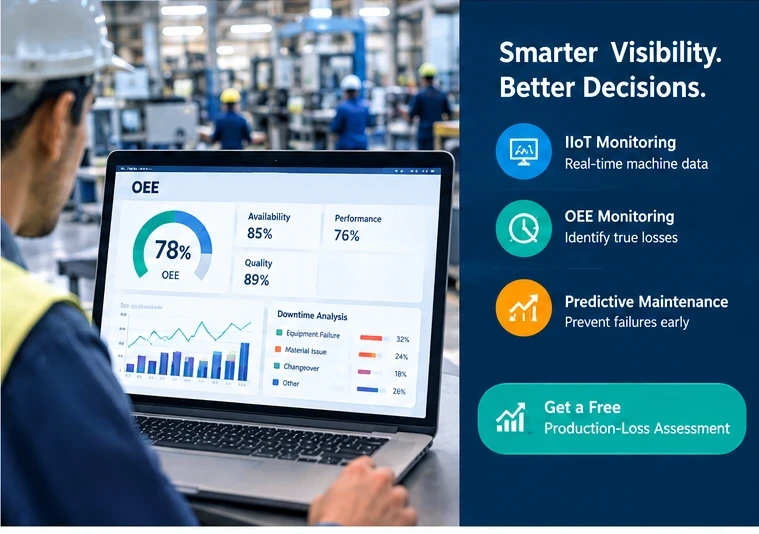
Connecting directly to PLCs, numerical controllers, and edge sensors captures machine-state transitions (Running, Idle, Faulted, Changeover) instantaneously without manual entry.
Every stoppage is timestamped to the millisecond. Operators categorize stops through intuitive touchscreens with enforced reason code trees, standardizing reporting across all shifts.
Overall Equipment Effectiveness separates total performance into Availability, Performance, and Quality. For a comprehensive walkthrough, explore our detailed guide on OEE monitoring explained for manufacturers.
High-frequency vibration, thermal imaging, and acoustic analysis track physical wear on gearboxes, spindles, and compressors long before thermal failure occurs.
Telemetry feeds directly into ERP, MES, and quality databases, allowing supervisors to correlate physical machine stresses with finished batch yield and scrap costs.
Machine learning models identify multi-sensor degradation patterns, predicting failures weeks in advance so maintenance can be scheduled during planned changeover windows.
A 30-Day Checklist for Investigating Production Losses
Before procuring expensive sensor hardware or software licenses, manufacturing leaders can run a focused 30-day diagnostic evaluation on their single most critical production line:
Establish the Operational Baseline
- Select one clear plant bottleneck machine or high-frequency tripping cell.
- Consolidate the previous 90 days of maintenance work orders, downtime logs, and scrap reports for that asset.
- Audit whether different shifts use conflicting downtime categorization names or round off stoppage times.
- Calculate your factory's true financial cost per downtime hour on that cell (including labor, scrap, and margin).
Isolate Recurring Failure Patterns
- Rank historical downtime reasons by total cumulative duration rather than simple occurrence frequency.
- Conduct shift-floor observations to audit unrecorded micro-stops (stops under 3 minutes).
- Review HMI alarm logs to identify “alarm floods” and frequently silenced nuisance warnings.
- Interview frontline operators and maintenance technicians to document known informal workarounds.
Connect Telemetry with Operational Context
- Identify existing PLC sensors (temperatures, drive loads, pressures) that are not currently logged or archived.
- Correlate downtime timestamps with specific SKU production orders, changeover events, and raw material lots.
- Shortlist the top 2–3 failure modes that account for 70%+ of the machine's unplanned availability losses.
- Determine whether root causes stem from mechanical wear, process drift, SOP deficits, or supplier material variance.
Formulate Countermeasures & Automation Roadmap
- Agree on engineering countermeasures for the priority failure modes with cross-functional team buy-in.
- Define whether automated OEE monitoring, edge IIoT sensors, or ERP data integration is required to prevent recurrence.
- Assign direct engineering ownership and set target OEE recovery metrics for the next 60 days.
- Review post-countermeasure shift yield to verify that root causes have been permanently resolved.
How Vivify Soft Tech Can Help Eliminate Unplanned Downtime
Once an industrial enterprise understands where and why capacity is slipping away, the next priority is deploying robust, non-intrusive technology to capture, analyze, and act upon shop-floor telemetry in real time.
Vivify Soft Tech engineers end-to-end industrial software, IIoT integration, automated OEE tracking, and smart factory solutions. We partner with manufacturing enterprises in Chennai, Tamil Nadu, across India, and globally to turn siloed machine telemetry into measurable capacity gains:
Connect legacy and modern machines via OPC-UA, MQTT, Modbus, and custom edge gateways to ingest high-frequency machine states without disrupting existing PLC logic.
Deploy intuitive, responsive shop-floor dashboards displaying live Availability, Performance, Quality, micro-stop tallies, and automated Pareto downtime charts.
Bridge machine telemetry directly into enterprise software to correlate equipment stresses with batch numbers, SKU recipes, maintenance histories, and scrap costs.
Build automated vibration and thermal anomaly alerting pipelines that notify reliability engineers before critical bearings, gearboxes, or spindles degrade.
Develop bespoke production tracking tools, operator HMI interfaces, and automated quality-check portals built precisely around your plant's unique standard operating procedures.
Our manufacturing specialists conduct on-site or virtual capacity assessments to benchmark your OEE baseline and identify immediate capacity recovery targets.
Frequently Asked Questions About Unplanned Downtime
Common causes include equipment failure, process instability, raw material variation, quality defects, incorrect machine setups, and delayed operator response to alarms. Stoppages rarely stem from a single factor; the visible breakdown is often the final stage of compounding warning signs that went unaddressed.
Explore Industrial Automation Solutions & Citations
The ultimate objective on a modern shop floor is not simply getting a tripped machine running again. It is understanding why it stopped, preventing repeat failures, and unlocking the latent capacity already present in your capital equipment.
Explore how Vivify Soft Tech empowers manufacturing organizations through our specialized engineering practices:
- Industrial IoT Solutions – Real-time telemetry, automated machine-state capture, and edge sensor pipelines.
- OEE Monitoring Explained for Manufacturers – How Availability, Performance, and Quality expose hidden capacity losses.
- Industrial Software & Automation Services – End-to-end industrial software engineering, PLC SCADA integration, and factory automation.
- Stamping Line Micro-Stops Investigation – Why brief unrecorded stops cost presses 10%–20% capacity.
- Digital Transformation in Manufacturing – Practical steps for modernizing plant operations and enterprise systems.
- Manufacturing Automation Case Studies – Real-world results and operational ROI from industrial technology deployments.
Authoritative Industry Research & References:
• McKinsey Operations: Predictive Maintenance in Process Manufacturing
• McKinsey Insights: Transforming Advanced Manufacturing through Industry 4.0
• NIST (Thomas & Weiss): Research on Manufacturing Maintenance and Unplanned Downtime
• Siemens: The True Cost of Downtime Report
• MaintainX: 2024 State of Industrial Maintenance Benchmarks
Stop Guessing Why Your Production Line Halts
Vivify Soft Tech helps manufacturing teams uncover hidden micro-stops, connect isolated machine telemetry, and deploy high-accuracy OEE and condition monitoring. Book your complimentary production-loss consultation today.